
You build this elaborate risk scoring model. Heat maps, weighted factors, probabilistic calculations. Three months later, your inspectors are still running the same fixed monthly rounds they've always done. The risk scores sit in a spreadsheet somewhere while your high-risk equipment gets the same inspection frequency as your parking lot light fixtures.
The disconnect between risk assessment and actual inspection scheduling breaks most RBI programs before they even start. Not because the risk models are wrong, but because nobody figured out the translation layer—how a risk score of 73 becomes "inspect every 2 weeks instead of monthly."
This pattern shows up everywhere. Teams spend months perfecting their risk models while completely ignoring the operational mechanics of actually changing inspection frequencies based on those scores.
The scheduling translation problem nobody talks about
Most risk-based inspection implementations follow this trajectory: management buys into RBI, consultants develop sophisticated risk matrices, training happens, then... nothing changes operationally. Field teams keep following their old schedules because nobody built the bridge between "this asset scores high risk" and "therefore inspect it Tuesday instead of next month."
Your risk model produces smooth gradients of risk, but your scheduling system needs clear buckets. Without explicit rules for this translation, inspectors default to what they know: the old schedule.
Consider a typical refinery with 2,000 inspection points. Their risk model scores each point from 1-100 based on consequence and probability factors. But when you ask "so what's the inspection frequency for a score of 68?" you get blank stares. Is 68 high enough for weekly? Monthly? Who decides?
The scoring rubric becomes your operational translator. It turns abstract risk numbers into concrete scheduling decisions that field teams can actually execute.
Building scoring rubrics that inspectors actually follow
A functional scoring rubric needs three components: clear risk bands, explicit frequency mappings, and override triggers. Most teams mess up by making their rubrics either too simple (losing nuance) or too complex (becoming unusable).
Eliminate inspection delays and errors.
Chekzly helps you plan, execute, and document inspections efficiently and accurately.
- Real-time inspection tracking
- Automated report generation
- Compliance and checklist management
No credit card required
Start with risk bands that match your operational reality. If you can realistically support five different inspection frequencies, create five risk bands. Don't create twelve bands if you can only handle three inspection schedules operationally.
| Risk Band | Score Range | Base Frequency | Override Triggers |
|---|---|---|---|
| Critical | 80-100 | Weekly | Any safety incident → Daily for 30 days |
| High | 60-79 | Bi-weekly | Performance degradation → Weekly |
| Medium | 40-59 | Monthly | No issues for 6 months → Quarterly |
| Low | 20-39 | Quarterly | Regulatory requirement → As specified |
| Minimal | 0-19 | Annual | Never below annual for compliance |
The score ranges need buffer zones to prevent frequency thrashing. If high risk starts at exactly 60, an asset bouncing between 59 and 61 would constantly change inspection frequency. Build in hysteresis—maybe it takes 65 to move up to high risk, but doesn't drop back to medium until it falls below 55.
Override triggers handle the edge cases that pure scoring misses. A pump might score medium risk, but if it just failed, you temporarily bump it to weekly inspections regardless of its calculated score. These overrides need clear activation and deactivation criteria, or they become permanent schedule distortions.
The sampling problem: validating your risk predictions
Your risk scores are predictions. The only way to know if they're accurate is to sample outside your normal inspection schedule and see what you find.
Most teams completely skip this validation step. They implement risk-based frequencies, then never check if their high-risk assets actually fail more often than low-risk ones.
Here's how sampling validation works in practice. Every month, randomly select 5% of your low-risk assets for inspection outside their normal schedule. If these "should be safe" assets show problems at the same rate as your high-risk assets, your risk model needs recalibration.
Track your sampling results systematically:
-
False negatives
Low-risk assets that failed when sampled
-
False positives
High-risk assets with no issues despite frequent inspection
-
Risk drift
Assets whose actual failure rate diverges from predicted over time
The sampling rate needs balance. Too little sampling (under 3%) and you won't catch model problems for months. Too much sampling (over 10%) and you're basically abandoning risk-based inspection for random inspection. Most operations find 5-7% sampling optimal.
A water utility discovered this the hard way. Their risk model marked residential service lines as low risk, industrial lines as high risk. Six months of random sampling revealed residential lines failed 3x more often. Turns out industrial customers maintained their equipment better, while residential lines corroded silently. They had their risk model completely backwards.
Scheduler system impact: the technical integration everyone forgets
Even with perfect scoring rubrics, you still need to actually change the inspection schedule. This means integrating with whatever scheduling system your team uses—whether that's enterprise CMMS, Excel spreadsheets, or sticky notes on a whiteboard.
The integration complexity depends on your current scheduling approach. Fixed calendar schedules are easiest to modify—you just change the recurring frequency. Dynamic scheduling based on runtime hours or cycle counts requires more sophisticated logic.
Consider the ripple effects of frequency changes. If you suddenly move 200 assets from quarterly to monthly inspection, can your team handle the 3x increase in inspection volume? Most can't, which means you need phased transitions or additional resources.
Resource leveling becomes critical. You can't have all your high-risk equipment scheduled for inspection on the same day. The scheduling system needs to spread the work while respecting frequency requirements. This usually means:
-
Setting inspection windows rather than fixed dates (inspect within week 12, not specifically on March 15)
-
Building in capacity buffers (only scheduling 80% of theoretical capacity)
-
Creating escalation rules for delayed inspections based on risk level
A chemical plant implemented this badly and learned the hard way. Their scheduler dutifully moved all high-risk vessels to monthly inspection... scheduling all 47 vessels for the first Monday of each month. The inspection team revolt was immediate.
Feedback loops: closing the learning cycle
The most sophisticated risk models fail without feedback loops. Your risk scores need continuous calibration based on actual inspection findings, not just theoretical calculations.
Build three distinct feedback mechanisms:
Immediate corrections happen when inspection results directly contradict risk scores. A low-risk pump catastrophically fails? Its risk score immediately jumps, but more importantly, you examine why your model missed this failure mode.
Trend adjustments track patterns over time. If assets in Building A consistently show more degradation than identical assets in Building B, your model needs location or environmental factors it's currently missing.
Model retraining happens quarterly or annually, incorporating all accumulated inspection data to refine risk predictions. This isn't tweaking individual scores—it's recalibrating the entire model based on observed reality.
The challenge is making these feedback loops systematic rather than ad-hoc. Every inspection needs to feed data back into the risk model, not just the dramatic failures. Create standard fields in your inspection forms:
-
Risk score validation (does condition match predicted risk?)
-
Degradation rate observation (faster or slower than modeled?)
-
New failure modes discovered
-
Environmental factors not in model
A pharmaceutical manufacturer built this particularly well. Every inspection included a "model feedback" section where inspectors rated whether the asset condition matched its risk score. After six months, they identified that stainless steel equipment in areas with chloride exposure degraded 5x faster than their model predicted. This single insight prevented three potential product contamination events.
Common implementation failures and fixes
The override avalanche. Teams start with reasonable override rules, then keep adding exceptions until overrides become the norm. One facility ended up with 60% of assets on "temporary" override schedules that had lasted over a year. Solution: quarterly override audits where each override must be rejustified or removed.
Score gaming. When inspectors know the scoring factors, they might manipulate inputs to get desired frequencies. "This pump is definitely critical to operations" when they want overtime hours, but "fairly redundant" when they're busy. Solution: separate the teams doing risk scoring from those doing inspections, or use objective data sources for scoring inputs.
Frequency thrashing. Assets bouncing between risk categories every assessment, creating scheduling chaos. A turbine alternating between monthly and quarterly inspection based on tiny score variations wastes everyone's time. Solution: implement hysteresis bands and minimum stability periods—no frequency changes within 6 months unless triggered by actual events.
Compliance conflicts. Your risk model says annual inspection, but regulations require quarterly. These conflicts create confusion and compliance risk. Solution: build regulatory requirements as floor constraints in your rubric—risk scoring can increase frequency but never decrease below regulatory minimums.
Making the decision: when RBI scheduling makes sense
Risk-based inspection scheduling isn't universally appropriate. It works best when you have:
-
Diverse equipment with varying failure consequences
-
Resource constraints requiring prioritization
-
Good historical data on failure patterns
-
Stable operations without constant configuration changes
It struggles when:
-
Regulatory requirements dictate fixed schedules
-
You lack inspection history for model training
-
Equipment population is highly homogeneous
-
Failure consequences are uniformly catastrophic
A food processing plant learned this distinction expensively. They implemented RBI for their entire facility, including customer-facing areas. When a customer slipped on a wet floor in an area deemed "low risk" for inspection, the lawsuit explicitly cited their reduced inspection frequency. Some areas need fixed schedules for liability reasons regardless of calculated risk.
The path forward: implementation roadmap
Start small with a pilot area. Pick 50-100 assets where you have good failure history and flexible scheduling authority. Build your initial rubric, implement the frequency changes, and run for three months. Track everything—inspection findings, scheduling conflicts, resource impacts, and model accuracy.
The pilot reveals the practical problems your full implementation will face. Maybe your inspectors can't actually distinguish between "degraded" and "significantly degraded" in your scoring criteria. Perhaps your scheduling software can't handle variable frequencies. Better to discover these issues with 50 assets than 5,000.
After pilot refinement, expand gradually. Add asset classes where the risk differentiation is clearest first. Pumps with obvious criticality differences before generic piping. Electrical switchgear before lighting circuits.
Modern inspection management platforms now include built-in RBI scheduling capabilities, automatically translating risk scores to inspection frequencies while handling the complexity of resource leveling and regulatory compliance. These AI-powered systems track the feedback loops automatically, continuously refining risk models based on actual inspection results. But even with automated scheduling optimization, you still need clear rubrics and decision rules—the software can execute the translation, but humans must define what the translation should be.
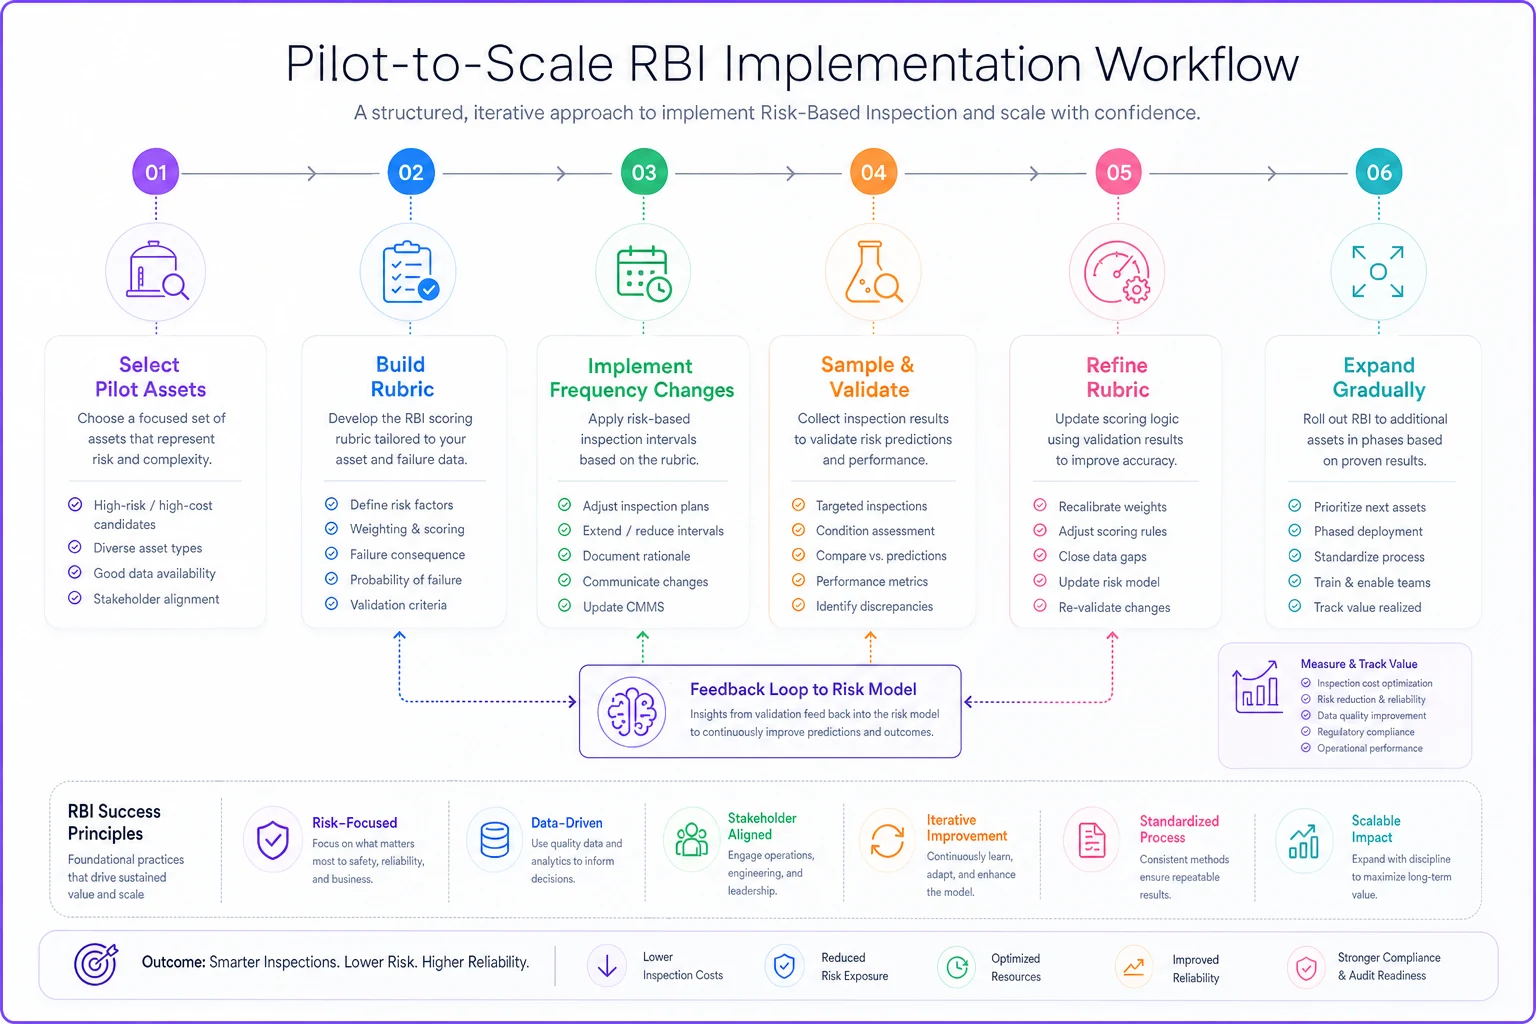
A simple diagram of the pilot → refine → expand workflow and its feedback loops.
From risk theory to inspection reality
Risk-based inspection prioritization only works when risk scores connect to real schedule changes through clear, practical rubrics. Without this translation layer, even the most sophisticated risk models become expensive decoration while inspectors continue their old routes.
Start with operational reality, not risk theory. Build rubrics that match your actual scheduling capabilities. Create feedback loops that catch model errors before they become failures. Implement gradually with careful monitoring rather than wholesale schedule revolution.
Remember that risk scoring serves operations, not vice versa. If your scoring system makes scheduling harder or inspection quality worse, fix the system. The goal isn't perfect risk quantification—it's better inspection outcomes with available resources.
The teams that succeed with RBI scheduling share one characteristic: they spent as much time on the operational implementation as they did on the risk model itself. They built scoring rubrics collaboratively with field teams, tested frequency changes carefully, and refined continuously based on actual results. The translation from risk score to inspection schedule might seem like a minor implementation detail, but it's the difference between RBI as theory and RBI as practice.
Ready to modernize your inspection process?
Join 500+ inspection teams using Chekzly to reduce paperwork, improve compliance, and accelerate reporting.