
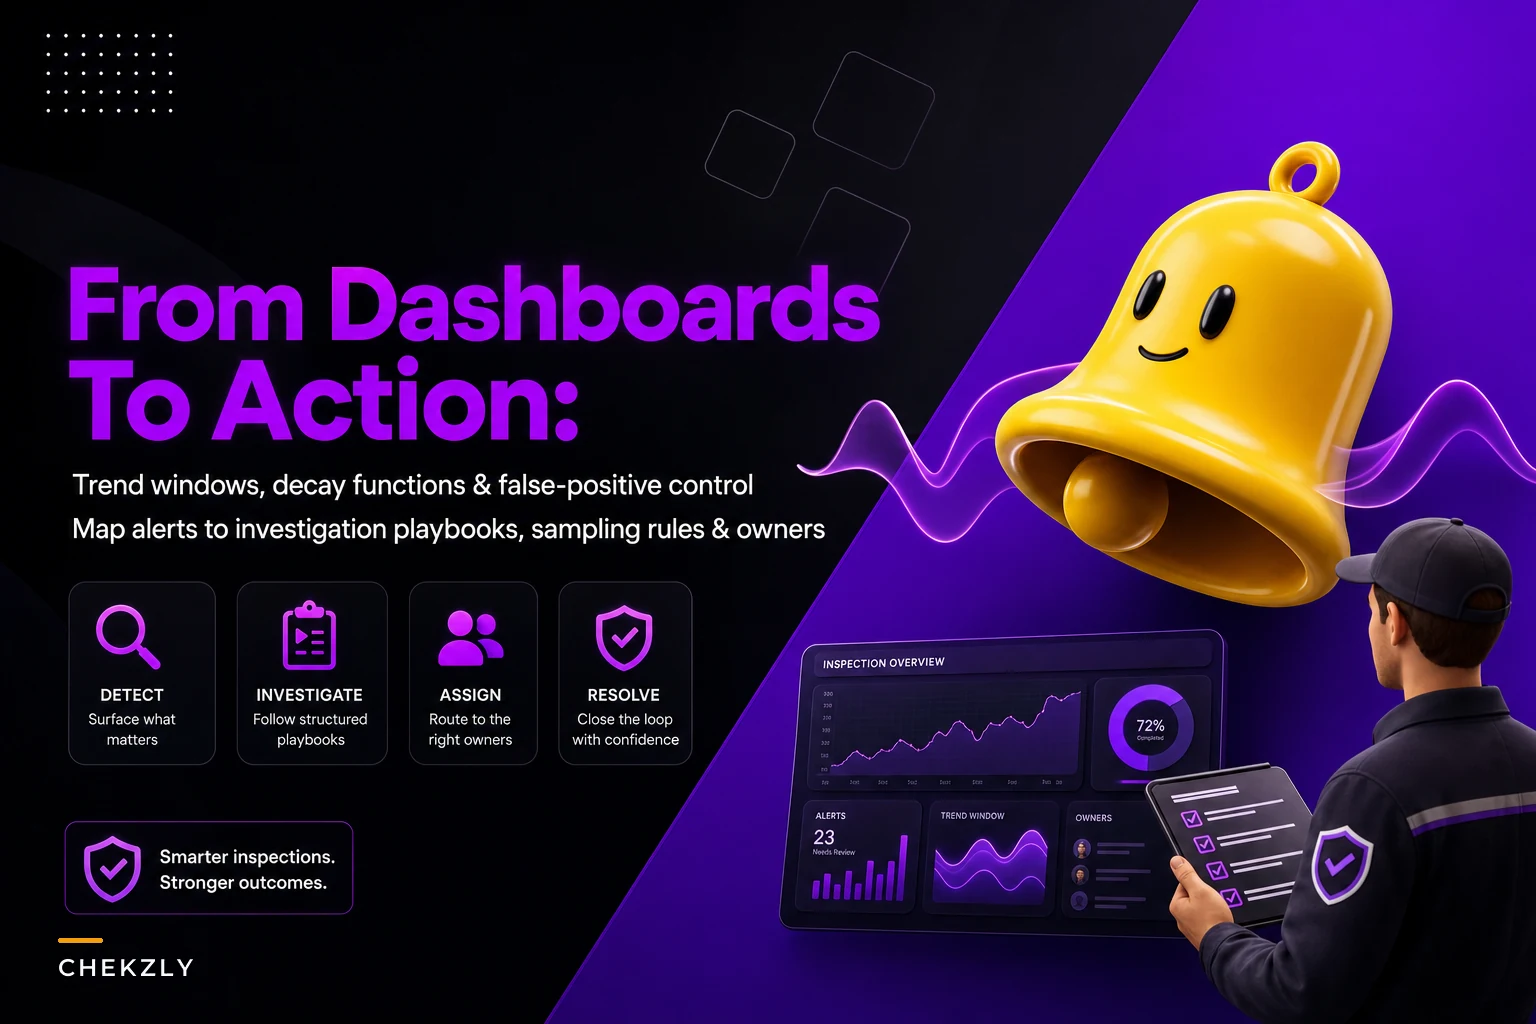

Most inspection dashboards are decorative. They light up, someone glances at them in the Monday review, and the chart with the ugly upward slope gets a "let's keep an eye on that." Three weeks later the same slope is a finding, or a recall, or an angry regulator email.
The gap isn't visibility. Teams see the trend. The gap is that nobody has written down what a specific movement in a specific metric should cause someone to do. So let's build that. This is a worked playbook for inspection trend detection alerts — the actual windows, the decay functions, how to keep false positives from burning out your team, and the escalation recipes that map a firing alert to a named investigation playbook and a sampling rule.
Staying narrow on purpose here. This isn't a KPI taxonomy piece — if you need the metric groundwork first, the practical inspection analytics program breakdown covers that. This assumes you already have clean time-series and you want them to do something.
The core problem: a trend is not an alert
A team picks a metric — say, defect rate on a particular assembly line inspection — and sets a threshold. "Alert me if defect rate goes above 4%."
That threshold fires on noise. One bad batch, one new inspector who's stricter, one Friday afternoon, and you get a ping. After the third false alarm, people mute it. Now the alert is worse than nothing, because everyone assumes it's crying wolf even when it isn't.
A raw threshold has no memory and no shape. It doesn't know if 4.1% is a one-day blip or the fourth day of a steady climb. Trend detection is about the shape over a window, not a single value crossing a line. That distinction is the whole game.
Trend windows: pick the window to match how fast the thing can hurt you
The first real decision is window length, and teams almost always get this wrong by defaulting to whatever's convenient — usually "last 30 days" because that's what the dashboard shows.
Eliminate inspection delays and errors.
Chekzly helps you plan, execute, and document inspections efficiently and accurately.
- Real-time inspection tracking
- Automated report generation
- Compliance and checklist management
No credit card required
| Metric type | Realistic window | Why this window |
|---|---|---|
| Out-of-tolerance rate on a safety-critical gauge | 3–5 inspections (event-based, not days) | One bad calibration can invalidate everything downstream — you can't wait for a calendar window |
| Photo/evidence rejection rate | 7–10 day rolling | Slow-building habit problem; a week smooths out one messy inspector |
| Re-inspection / rework rate per site | 2–3 weeks rolling | Site-level drift takes time to show signal above normal variance |
| Inspector agreement (same asset, two inspectors) | rolling last 20 paired inspections | You need enough pairs before the number means anything |
Notice two of those are event-based windows, not time-based. Most dashboards can't express this. "Last 5 inspections" is a far better window for a low-volume, high-consequence check than "last 30 days," because on a slow line, 30 days might only contain six inspections and one of them dominates the average.
A pattern worth internalizing: high-consequence, low-volume metrics want event windows. High-volume, habit-driven metrics want time windows.
Decay functions: recent inspections should weigh more, but not everything
Once you've got a window, you have to decide whether every point in it counts equally. Usually it shouldn't.
A flat rolling average treats an inspection from 13 days ago the same as this morning's. That's fine for slow, stable processes. But if you're trying to catch emerging drift, you want recent data to shout and old data to whisper. That's a decay function.
Exponential decay (EWMA-style). Each older point gets multiplied by a decay factor. A common, sane starting point is a smoothing factor around 0.3 — meaning today's value contributes roughly 30% and the running history carries the rest. Higher factor = twitchier, catches drift faster, more false positives. Lower factor = smoother, slower, more misses.
A worked example. Say your rejection rate over the last five inspections is:
2%, 2%, 3%, 5%, 6%
-
Flat average = 3.6%. Looks fine, probably under threshold.
-
EWMA with factor 0.4 weights that recent climb and lands closer to ~4.6%, and more importantly the EWMA line itself is sloping up — which is the signal you actually care about.
The flat number hides the climb. The decayed number surfaces it. That's the entire point of decay: detecting the direction of travel, not the average altitude.
Linear decay is the simpler cousin — the oldest point in a 10-point window gets weight 1, the newest gets weight 10, everything in between scales linearly. Easier to explain to a skeptical ops director who doesn't want to hear the word "exponential." Slightly less responsive, but honestly good enough for most rework and evidence-quality metrics.
One thing worth noting: teams almost never need anything fancier than these two. If someone's proposing a seasonal-decomposition model for inspection rework rates, ask them how many inspections per week you actually run. Below a few hundred a week, the fancy model is just fitting noise.
False-positive control: the difference between an alert people trust and one they mute
This is where most alerting programs quietly die. Perfect windows and perfect decay don't matter if the alert fires too often and humans stop reading it. Trust is the scarcest resource in an alerting system.
1. Require persistence, not a single crossing. Don't fire when the decayed value crosses the line once. Fire when it stays across for N consecutive points. A "3-in-a-row" rule kills the overwhelming majority of single-blip false positives. You trade a little detection speed for a lot of credibility.
2. Use a two-tier band. Set a watch level and an alert level. Crossing the watch level logs quietly — no ping, just a flag on the dashboard. Crossing the alert level, or sitting in the watch band for several windows, actually notifies someone. This gives you an audit trail of "we saw it building" without spamming inboxes.
3. Baseline against the right comparison. A defect rate of 5% might be alarming at Site A and totally normal at Site B. Alerting against a global threshold generates constant false positives at your naturally-noisier sites. Baseline each stream against its own recent history, or against a peer group of similar sites. This alone can cut false alerts dramatically.
Start with a 3-in-a-row persistence rule when onboarding new streams to balance detection speed and alert credibility.
A realistic tuning target: on a mature stream, you want fewer than one false alert per stream per month. If a single metric is firing weekly and most of those firings resolve to nothing, your persistence rule is too loose or your window is too short. Fix it before people learn to ignore it — because once they do, retuning won't win the trust back easily.
Mapping alerts to investigation playbooks
An alert that says "rejection rate is trending up" and nothing else just moves the confusion downstream. The manager now has to figure out what to do, which means the alert didn't actually save any thinking.
The fix is an escalation recipe: every alert type is pre-mapped to a named investigation playbook and a sampling rule. When it fires, the person receiving it gets the "what now" attached.
A worked recipe for a single alert:
-
Immediate action
Freeze acceptance of results from the affected gauge(s) pending review. Not the whole line — just the affected instrument stream.
-
Playbook triggered
"Calibration drift investigation." Pull the last passing cert, the calibration interval, and every inspection since the last cert.
-
Sampling rule
Re-inspect a sample of the assets passed since the last known-good inspection — not all of them, but enough. A defensible starting sample: the square root of the population passed in that window, minimum of 8, weighted toward the most recent passes.
-
Escalation timer
If the drift isn't explained within two business days, escalate from line supervisor to quality manager.
-
Closeout condition
Alert clears only after the decayed value drops back below the watch band and the sample re-inspection comes back clean.
The magic isn't any single step. It's that nobody has to invent the response mid-incident. The recipe was written on a calm Tuesday, not during a scramble.
Build one of these for each alert class. You don't need fifty. Most inspection programs have maybe six to ten alert types that matter: calibration drift, evidence-quality decline, inter-inspector disagreement, rework spikes, overdue-inspection buildup, vendor-result anomalies. Write a recipe for each.
A sampling-rule cheat sheet you can steal
The sampling rule is the part teams most often hand-wave. "Go check some of them" isn't a rule. Here's a usable set:
-
Confirmatory sample (is the alert real?) small and recent-weighted. 8–12 units, most recent first. Cheap, fast, answers "do we actually have a problem."
-
Scope sample (how far back does it go?) back-fills toward the last known-good point. Sample size scales with the population in that window — square-root rule is a reasonable default.
-
Containment sample (did we miss anything downstream?) only if the confirmatory sample fails. Pull from assets already released or shipped, prioritized by consequence.
The mistake to avoid: jumping straight to a 100% re-inspection because it feels thorough. On anything but the highest-consequence streams, 100% re-inspection is expensive, slow, and often unnecessary — and the delay itself creates risk. Start with the confirmatory sample. Escalate the sampling only when the cheaper sample tells you to.
Real scenario: a mid-sized third-party inspection firm
A firm running roughly 40 inspectors across a handful of regional sites had a rework problem they couldn't see clearly. Their dashboard showed a monthly rework rate, and it looked "fine" — hovering around 6% most months.
What the monthly flat average buried: one site had been climbing from about 4% to over 11% across roughly seven weeks, while two other sites drifted down, keeping the blended number flat. Classic averaging trap.
They rebuilt the alert three ways: per-site streams instead of blended, a two-week event-weighted window with light exponential decay, and a 3-in-a-row persistence rule with per-site baselining. The climbing site tripped the alert in what would have been week four instead of surfacing as a client complaint in week eight.
Root cause turned out to be mundane — a checklist revision that had quietly changed how one failure category was recorded at that site. Cost of catching it four weeks earlier: they avoided re-inspecting a full month of releases and one contract stayed intact. Rough internal estimate of what the earlier catch saved was somewhere in the low tens of thousands, mostly in avoided re-inspection labor and one very awkward client conversation.
The lesson wasn't "buy better analytics." It was: the blended metric was the bug. Split the streams, weight recency, require persistence.
When this is overkill
Not every program needs this. Worth being honest about it.
-
Very low volume. If a site runs a dozen inspections a month, you don't have enough data for decay functions to mean anything. Read the raw numbers and trust a human.
-
Stable, low-consequence metrics. If a metric has never once led to a real decision, don't build an alert recipe for it. You'll just add noise.
-
No one owns the response. This is the big one. An escalation recipe with no named owner is theater. If you can't assign a person to each playbook, don't build the alert yet — build the ownership first.
Who should not start here: teams that haven't defined what actually drives their inspection schedules. Alerting is downstream of prioritization. If your scheduling logic is still vibes-based, the more useful work is upstream — the piece on designing risk scores that actually change inspection schedules is the better starting point, because there's no point alerting on drift if nothing changes when you find it.
Where tooling quietly helps
You can run all of this in a spreadsheet at small scale, and plenty of good programs do. It gets painful when you have many streams, per-site baselines, event-based windows, and escalation timers that need to actually page someone. That's where a workflow platform earns its keep — not because the math is hard, but because keeping the recipes wired to real notifications, sampling triggers, and audit logs is tedious to maintain by hand.
Here's a simple workflow diagram.
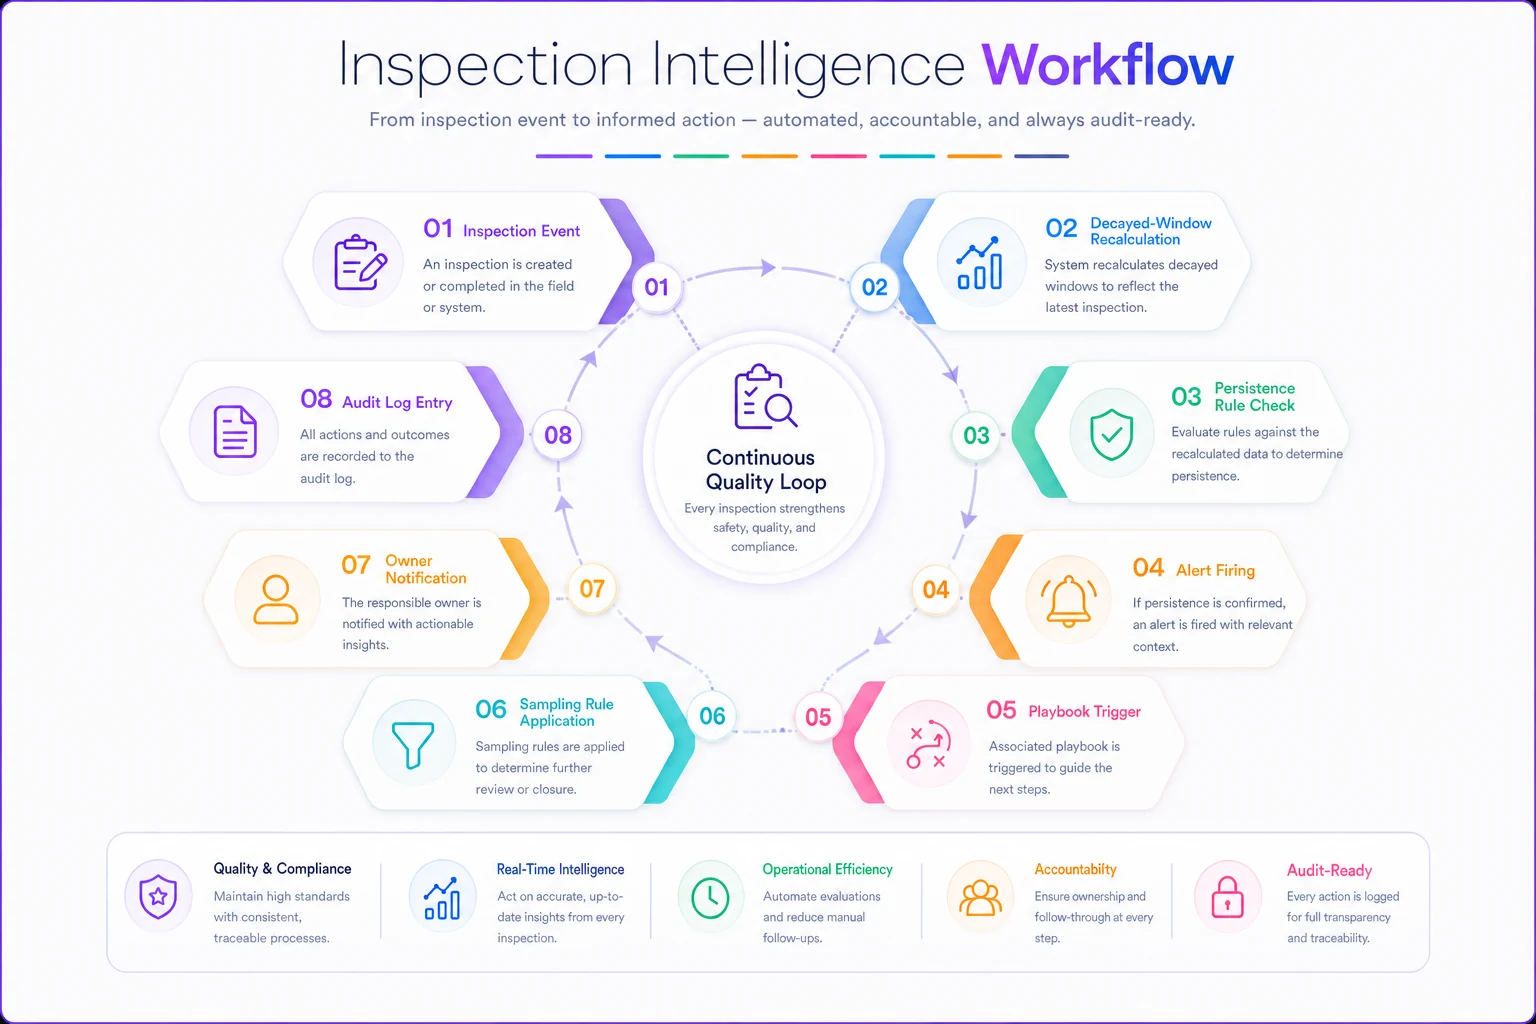
The useful role for automation here is unglamorous: recalculate the decayed windows on each new inspection, check persistence rules, fire the right recipe to the right owner, open the investigation record with the sampling rule pre-attached, and log every firing for the audit trail. It's the connective tissue between the chart and the action — which is exactly the gap this whole thing started with.
Bottom line
Dashboards show you slopes. They don't decide anything. The programs that actually catch drift early aren't the ones with the prettiest charts — they're the ones that decided, in advance, what a specific movement means and who does what when it happens.
Pick windows that match how fast the metric can hurt you. Weight recent data with a simple decay so you're detecting direction, not altitude. Guard your team's trust with persistence rules and per-stream baselines. And most importantly, pre-write the escalation recipe: alert → playbook → sampling rule → owner → closeout condition. Do that for the six to ten alerts that actually matter, and inspection trend detection stops being a Monday-morning "let's keep an eye on that" and starts being something the system handles on its own.
Dashboards show you slopes. They don't decide anything. The programs that actually catch drift early aren't the ones with the prettiest charts — they're the ones that decided, in advance, what a specific movement means and who does what when it happens.
Pick windows that match how fast the metric can hurt you. Weight recent data with a simple decay so you're detecting direction, not altitude. Guard your team's trust with persistence rules and per-stream baselines. And most importantly, pre-write the escalation recipe: alert → playbook → sampling rule → owner → closeout condition. Do that for the six to ten alerts that actually matter, and inspection trend detection stops being a Monday-morning "let's keep an eye on that" and starts being something the system handles on its own.
Ready to modernize your inspection process?
Join 500+ inspection teams using Chekzly to reduce paperwork, improve compliance, and accelerate reporting.