

Most inspection teams track everything but understand nothing. Completion rates live in one spreadsheet, defect counts in another, compliance percentages buried in quarterly reports, and inspector productivity metrics that nobody looks at until annual reviews. The data exists. It just doesn't drive decisions.
Building an inspection analytics program isn't about more dashboards. It's about creating a measurement system that connects field operations to business outcomes. The difference between teams that use metrics and teams that actually benefit from them comes down to structure — how KPIs are organized, who sees what data, and when reviews happen.
The KPI hierarchy that inspection teams actually need
Inspection metrics fall apart when everyone tracks different things. Regional managers watch completion rates while field supervisors count defects. Quality teams measure compliance percentages while operations tracks cycle times. Nobody connects these to actual business impact.
A functional KPI taxonomy has three layers that cascade from business outcomes down to field activities.
At the executive level, you're tracking program effectiveness — compliance rate trends, risk mitigation scores, operational cost per inspection. These roll up quarterly and answer whether the inspection program delivers value.
The middle layer covers operational health: inspector utilization, schedule adherence, quality score distributions, corrective action closure times. Regional managers and inspection leads review these weekly to catch emerging problems before they compound.
Field-level metrics drive daily decisions. Individual inspector performance, site-specific defect rates, equipment failure patterns, real-time completion status. These update continuously and trigger action when thresholds break.
What makes this structure work is the connection between layers. When field metrics slip, operational KPIs show the impact. When operational KPIs trend wrong, executive metrics predict the business consequence. Every number ties to a decision at the right level.
One facilities management company tracking 47 different metrics across five regional offices consolidated down to 18 KPIs organized by decision level. Within two months, their weekly review meetings dropped from 90 minutes of arguing about data to 30 minutes of making decisions. The metrics didn't change much — the organization did.
Dashboard templates by role (that people will actually use)
Generic dashboards fail because different roles need different information at different speeds. The regional manager checking quarterly trends doesn't need the same view as the field supervisor managing today's schedule. When everyone gets the same dashboard, nobody gets what they need.
Eliminate inspection delays and errors.
Chekzly helps you plan, execute, and document inspections efficiently and accurately.
- Real-time inspection tracking
- Automated report generation
- Compliance and checklist management
No credit card required
| Role | Details |
|---|---|
| Inspector Dashboard (Mobile-First) | Inspectors need three things: today's assignments, performance feedback, and quality alerts. Their dashboard shows current inspection status, next location with travel time, daily completion percentage, and any critical defects from the last 24 hours. The key metric here is time-to-next-inspection — the gap between finishing one inspection and starting the next. When that consistently exceeds 45 minutes, you've got a scheduling problem. |
| Field Supervisor Dashboard (Daily Operations) | Supervisors manage throughput and quality in real time. Their view shows team utilization by hour, inspections behind schedule, quality scores trending below threshold, and equipment issues affecting productivity. The critical metric is schedule variance — the difference between planned and actual completion times. When variance exceeds 20%, either the schedule assumptions are wrong or field execution is breaking down. |
| Regional Manager Dashboard (Weekly Patterns) | Regional views focus on trends and comparisons. Weekly completion rates by team, quality score distributions across sites, corrective action aging, cost per inspection trends. The metric that matters most here is the inspection effectiveness ratio — defects caught divided by inspection hours invested. This tells you whether more inspection activity is actually improving outcomes. |
| Executive Dashboard (Monthly Business Impact) | Leadership needs to see program ROI. Compliance trending against targets, risk incidents prevented, operational cost trends, program coverage gaps. The north star metric is usually risk-adjusted cost per asset — what it costs to maintain each asset at acceptable risk levels through inspection. |
Inspector Dashboard (Mobile-First) Inspectors need three things: today's assignments, performance feedback, and quality alerts. Their dashboard shows current inspection status, next location with travel time, daily completion percentage, and any critical defects from the last 24 hours. The key metric here is time-to-next-inspection — the gap between finishing one inspection and starting the next. When that consistently exceeds 45 minutes, you've got a scheduling problem.
Field Supervisor Dashboard (Daily Operations) Supervisors manage throughput and quality in real time. Their view shows team utilization by hour, inspections behind schedule, quality scores trending below threshold, and equipment issues affecting productivity. The critical metric is schedule variance — the difference between planned and actual completion times. When variance exceeds 20%, either the schedule assumptions are wrong or field execution is breaking down.
Regional Manager Dashboard (Weekly Patterns) Regional views focus on trends and comparisons. Weekly completion rates by team, quality score distributions across sites, corrective action aging, cost per inspection trends. The metric that matters most here is the inspection effectiveness ratio — defects caught divided by inspection hours invested. This tells you whether more inspection activity is actually improving outcomes.
Executive Dashboard (Monthly Business Impact) Leadership needs to see program ROI. Compliance trending against targets, risk incidents prevented, operational cost trends, program coverage gaps. The north star metric is usually risk-adjusted cost per asset — what it costs to maintain each asset at acceptable risk levels through inspection.
The mistake teams make is building these dashboards once and expecting them to hold up. Usage patterns shift every few months. Features get ignored, new questions surface, and what seemed critical becomes noise. Plan to revisit dashboard layouts every 90 days based on actual usage and decision patterns.
Review cadences that create accountability without meeting overload
The best metrics die in bad meetings. Teams build elaborate dashboards then review them in two-hour sessions where everyone presents numbers and nobody makes decisions. Or they skip reviews entirely and the dashboards become expensive wallpaper.
Effective inspection analytics programs follow a rhythm that matches operational tempo.
Daily huddles last 15 minutes and cover only exceptions — inspections behind schedule, critical defects found, inspector availability issues. The only question being answered is "what's broken right now." These happen at shift start, standing up, with only the people who can fix today's problems.
Weekly operational reviews dig into trends. These 45-minute sessions examine performance patterns, quality variations, and resource utilization. The focus is on next week's adjustments — reassigning inspectors, modifying schedules, updating priority lists. Teams that struggle with weekly reviews usually try to cover too much. Pick three operational metrics that predict next week's performance and cut the rest.
Monthly business reviews connect operations to outcomes. Did increased coverage reduce incidents? Did quality improvements lower rework costs? Did schedule optimization improve asset availability? These run 90 minutes and include both field operations and business stakeholders.
The quarterly strategic review questions the whole program. Are we inspecting the right things? Do our thresholds match actual risk? Should frequencies change? These challenge assumptions rather than just tracking performance.
A chemical plant running this cadence structure cut total meeting time by around 40% while actually improving metric visibility. They killed the weekly two-hour "metrics review" where everyone presented slides. Instead, they ran focused sessions at each cadence level with clear decision rights. Field supervisors stopped attending monthly business reviews. Executives stopped joining weekly operational sessions. Everyone got what they needed without the overload.
The analytics sprint that fixes broken metrics
Sometimes your entire measurement system needs rebuilding. Maybe you inherited a legacy mess, your operation changed significantly, or you realize current KPIs are driving the wrong behaviors. The analytics sprint gives you a structured way to redesign your measurement system in 30 days.
-
Week 1 Document current state chaos. List every metric tracked, who uses it, where the data comes from, and what decision it supposedly drives. You'll find massive redundancy. One transportation company discovered they tracked driver performance in seven different ways across three systems. None of them matched.
-
Week 2 Map decisions to data needs. Working backwards from actual decisions, identify what data would make those decisions obvious. If the decision is "which sites need inspection tomorrow," what metrics would make that clear? This builds your ideal-state KPI list — usually 70% smaller than your current one.
-
Week 3 Build minimum viable dashboards. Use whatever tools you have. Don't chase perfection — chase usability. If field supervisors need schedule variance, show it simply even if the calculation isn't sophisticated. The goal is proving the metric drives decisions, not building beautiful visualizations.
-
Week 4 Run parallel and adjust. Keep old metrics running while testing new ones. Use both systems in daily operations and note which actually influences decisions. You'll quickly see which new metrics matter and which old ones can die. You'll also find gaps where neither system provides the insight you actually need.
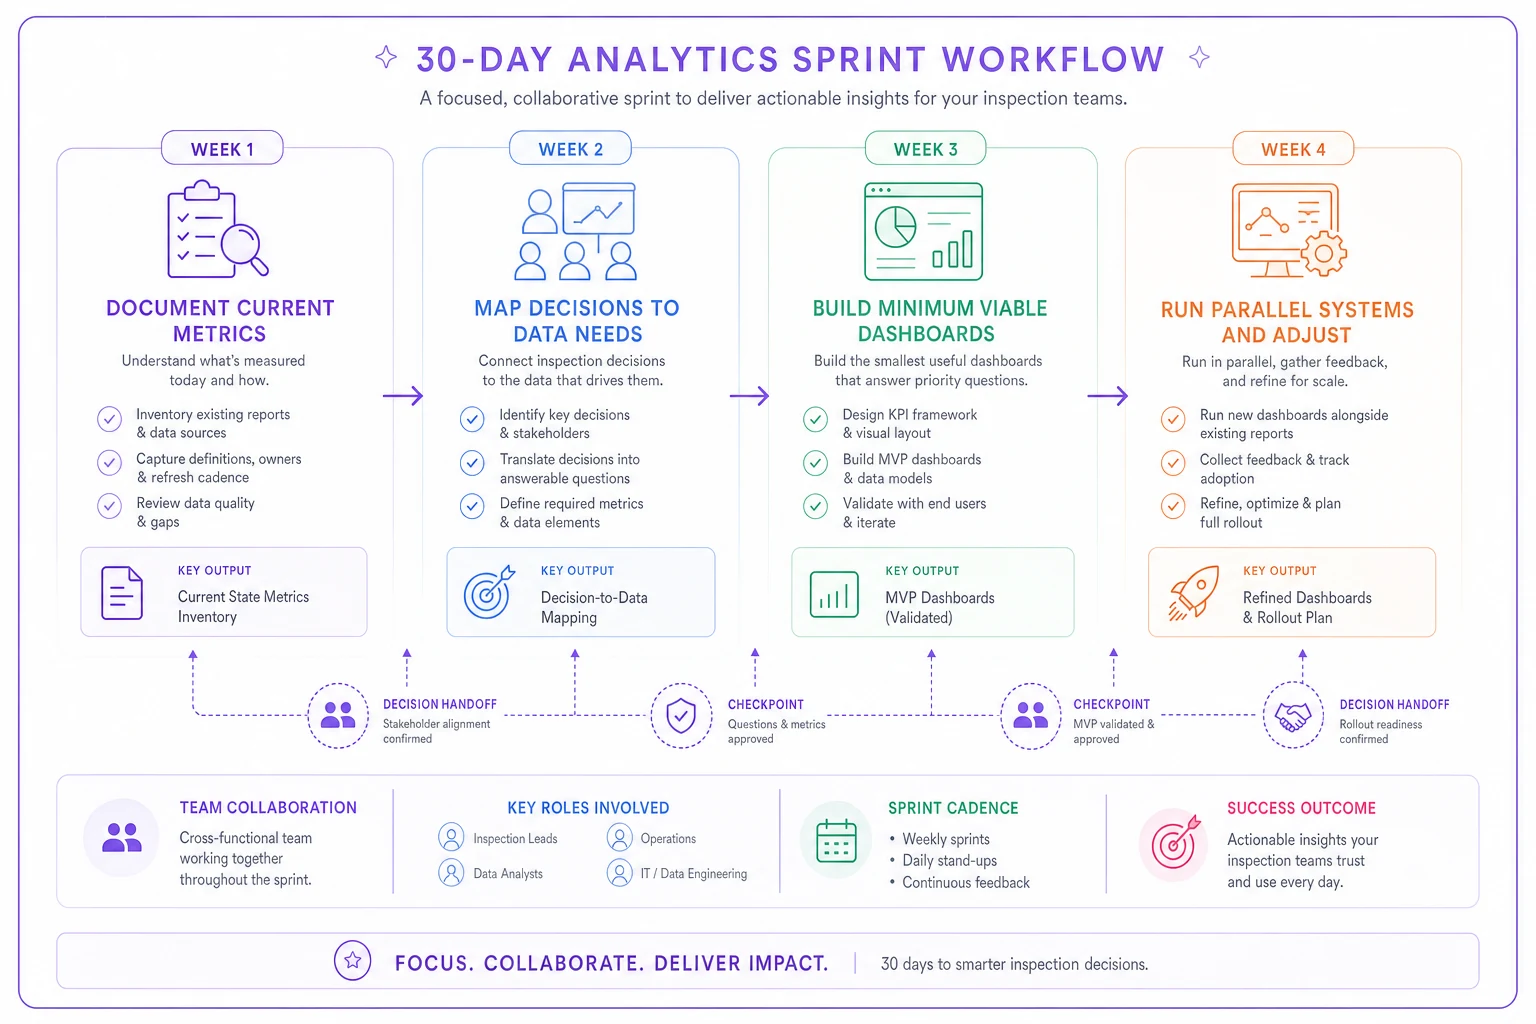
A simple visual of the sprint helps keep the team aligned.
The sprint output isn't just new dashboards — it's a validated measurement system with clear ownership and documented decision flows. Every metric has a purpose, an owner, and a review cadence.
Before and after: decisions transformed by proper metrics
The real test of any analytics program is whether it changes operational decisions.
Food processing facility Before: Inspections were assigned evenly across all production lines. Every line got daily visual inspection, weekly detailed inspection, and monthly deep-dive. Inspectors spent equal time everywhere because that seemed fair. After: They implemented defect-rate tracking by line and equipment type. Within six weeks, patterns emerged. Line 3 generated three times more defects than other lines. Packaging equipment failed five times more often than mixing equipment. They shifted 30% of inspection hours to high-defect areas. Defect escape rate dropped 44% with the same total hours. The key metric was defect density — defects per inspection hour by area. That one calculation revealed where time investment actually paid off.
Utility company Before: Infrastructure inspections ran on fixed calendars. Every substation got annual inspection regardless of condition or criticality. Crews drove preset routes hitting assets in geographic sequence. After: They built risk-scoring logic that connected asset condition to inspection frequency. High-risk assets moved to monthly inspection while stable assets shifted to 18-month cycles. They added a "time since last defect" metric that automatically increased frequency for problem assets. Route optimization based on risk-adjusted priorities cut drive time by 23%. The transformative metric was risk-days — cumulative risk exposure between inspections. This forced priority-based scheduling instead of calendar-based scheduling.
Aviation maintenance provider Before: Inspector productivity was measured by inspections completed per day. Inspectors rushed through checks to hit numbers. Quality suffered but looked fine on paper because completion rates stayed high. After: They replaced completion counts with quality-adjusted productivity — inspections completed multiplied by peer review scores. They added a finding rate metric — significant defects found per 100 inspections — to balance speed with thoroughness. Inspectors who rushed showed low finding rates. Those who found real problems got recognized even with fewer completions. Within three months, significant defect discovery increased 38% and rework from missed issues dropped by half.
The pattern is consistent. Old metrics measured activity. New metrics measured outcomes. That shift changes how teams operate.
Common analytics failures in inspection programs
Most inspection analytics programs fail in predictable ways. They start with executive support and budget, build elaborate dashboards that demo well, then slowly decay into complexity nobody uses.
The everything dashboard. Teams try to build one dashboard that serves everyone. It becomes a 47-widget monster that takes forever to load and satisfies nobody. Regional managers can't find trends. Field supervisors can't see today's issues. Inspectors ignore it entirely. The fix is role-specific views with narrow focus. Each dashboard should answer three to five specific questions, not every possible question.
The perfect data trap. Programs wait for clean data before building analytics. They spend months standardizing fields and building integration pipelines while operations run blind. Start with "good enough" data that drives decisions today. You can improve data quality while delivering value, not instead of delivering value.
The vanity metric focus. "Total inspections performed" sounds important but doesn't tell you whether you're inspecting the right things. "Percentage completed on time" looks good in reports but ignores whether those inspections actually found problems. Focus on metrics that change behavior, not metrics that fill slides.
Review theater. Elaborate monthly presentations where everyone shares positive metrics and explains away negative ones. No decisions get made. No actions get assigned. Real review sessions are short, focused on exceptions, and end with specific actions assigned to specific people with specific deadlines.
The automation obsession. Teams believe analytics software will solve their measurement problems. But without a clear KPI taxonomy and review cadences, expensive platforms just produce expensive noise. The fundamentals matter more than the technology.
Building sustainable analytics capabilities
Start with metric ownership. Every KPI needs a person responsible for definition, calculation, and interpretation. When metrics lack owners, they drift. Calculations change without notice. Dashboards show numbers nobody can explain. The owner doesn't need to build the dashboard — they just need to ensure the metric stays meaningful and actionable.
Document decision rules explicitly. When schedule adherence drops below 80%, what happens? Who gets notified? What actions trigger? Without documented rules, metrics become suggestions. A property management company documented 12 decision rules for their inspection metrics. New supervisors could make correct decisions from day one because the metrics told them exactly what to do.
Build calculation transparency. Nothing kills analytics trust faster than mystery numbers. When field supervisors can't explain how productivity scores get calculated, they ignore them. When inspectors don't understand quality metrics, they game them. Every metric needs a simple explanation. Include calculation examples in dashboard help text. Show the math in review sessions.
Include a one-line calculation example next to each KPI so field teams can verify numbers quickly.
Create feedback loops from field to analytics. The people using metrics daily know what's broken. But most programs have no channel for bottom-up feedback. That mobile dashboard that seemed great in design sessions might be unusable with gloves on. The productivity metric might be incentivizing shortcuts. Build monthly feedback sessions where field teams tell analytics teams what isn't working.
Plan for metric evolution. New inspection types emerge, team structures shift, technology capabilities expand. Metrics that matter today become irrelevant tomorrow. Build quarterly metric review sessions that honestly question whether current KPIs still drive the right decisions. Be willing to kill metrics that no longer serve their purpose.
Technology's role in scaling measurement
Manual analytics programs hit walls around 50 inspections per week. Beyond that, data collection becomes a full-time job. Spreadsheets corrupt. Reports take days to generate. Review meetings focus on explaining data problems rather than making decisions.
This is where operational software with built-in analytics becomes critical — not as a magic solution, but as infrastructure that makes measurement sustainable. The right platform automates data collection from field activities. Inspectors complete digital checklists and completion rates calculate automatically. Photos attach to findings and defect patterns surface without manual counting. GPS tracks actual inspection times and productivity metrics update in real time.
But automation without structure just generates more noise faster. The teams that succeed with analytics platforms define their KPI taxonomy first, then configure software to support it. They establish review cadences first, then automate report generation around them.
Modern inspection platforms now incorporate AI automation to surface patterns that might otherwise go unnoticed — anomaly detection flagging unusual defect clusters, natural language processing pulling insights from inspector notes, predictive models forecasting which assets need attention based on historical patterns. These capabilities augment human decision-making rather than replacing it.
The integration challenge is real. Inspection analytics need to connect with maintenance systems, compliance databases, and financial platforms. Each integration adds complexity but also adds context. When inspection findings automatically trigger work orders, the value of inspection becomes measurable. When compliance scores feed risk assessments, inspection priority becomes clear.
The path forward for inspection analytics
Building an effective inspection analytics program doesn't happen overnight. But it doesn't take years either. Most teams can transform their measurement capabilities in 90 days with focused effort.
Start by auditing your current metrics. List everything you track and honestly evaluate what drives decisions versus what fills reports. You'll probably find 80% of your metrics could disappear without impacting operations.
Design your three-tier KPI taxonomy. Connect field metrics to operational metrics to business metrics. Make sure each tier serves its audience with the right information at the right frequency.
Build role-specific dashboards that people will actually open. Start simple and iterate based on feedback. A basic dashboard people check daily beats an elaborate one people ignore.
Establish review cadences that match operational tempo. Daily exceptions, weekly trends, monthly outcomes, quarterly strategy. Keep sessions focused and decision-oriented.
Run an analytics sprint if your current system is beyond repair. Thirty days of focused effort can rebuild your entire measurement approach.
The best inspection programs measure what matters and ignore what doesn't. They don't track everything — they track the right things, reviewed consistently, by the right people. That's what shifts focus from activity to outcomes, from counting tasks to measuring impact.
Your inspection data tells a story about operational health. A properly structured analytics program ensures you hear what matters, when it matters, and can act before small problems turn into big ones.
Ready to modernize your inspection process?
Join 500+ inspection teams using Chekzly to reduce paperwork, improve compliance, and accelerate reporting.