



Most inspection managers can describe their program's problems in vivid detail. Closures dragging past 30 days. Inspectors burning half a day driving between sites. Reports bouncing back because a photo was missing or a field was blank. What they usually can't do is translate any of that into a number that survives a budget meeting.
That gap is why good programs get underfunded. Finance isn't hostile — they just can't fund a story. They fund a model. The difference between "we need better tooling" and "here's a 14-month payback with a downside case that still clears our hurdle rate" is often the difference between getting told to revisit next fiscal year and getting a signed PO.
This piece is about building that model. Not a generic ROI calculator you download and pray over, but a workbook structure that ties real operational KPIs to specific budget asks, runs a sensitivity check so nobody thinks you cooked the numbers, and collapses into a one-page summary an executive can approve on short notice.
Why inspection ROI cases fall apart
The typical inspection program budget request dies for one of three reasons, and they're worth naming because most managers have made at least one of them.
The first is savings that can't be traced to a line item. You claim the new system will "improve efficiency by 20%." Finance asks efficiency of what, measured how, compared to what baseline. Without a clean answer, the number gets mentally discounted to zero.
The second is benefits with no owner. You say rework will drop. Great — whose budget does that show up in? If reduced rework means an inspector handles more jobs per week, that's capacity, not cash. If it means you can avoid hiring the next inspector, that's an avoided cost you can actually point at. Those are very different claims and finance treats them differently.
The third — and this one's sneaky — is ignoring total cost of ownership. Managers pitch the license fee and forget implementation hours, data migration, training time, the parallel-run period where you're briefly paying for two systems at once. Then month four arrives, the "cheap" tool has consumed 200-plus hours of internal time, and the whole case looks dishonest even though the underlying logic was sound.
Across a lot of operational rollouts, the request itself is usually reasonable. The packaging is what fails. A workbook forces you to package it correctly, because every cell has to connect to something real.
The three KPI families that actually convert to dollars
Before you build anything, you need to know which metrics translate cleanly into money and which don't. Not every KPI belongs in an ROI model. Some are diagnostic — useful for running the program but useless in a budget conversation because you can't attach a defensible dollar figure.
Eliminate inspection delays and errors.
Chekzly helps you plan, execute, and document inspections efficiently and accurately.
- Real-time inspection tracking
- Automated report generation
- Compliance and checklist management
No credit card required
Three families do the heavy lifting.
Closure time is the gap between when an inspection is scheduled and when the whole package — findings, evidence, sign-off — is finished and filed. This is where money hides in plain sight. Long closures tie up capital in whatever the inspection is gating. A delayed equipment sign-off can stall a lease payment, a shipment, a certificate renewal. If you can point at even one downstream process that waits on closure, you can price the delay.
Travel and windshield time is the most literal cost you have. It's paid hours plus mileage producing zero inspection output. It's also the easiest number for finance to believe because it's just wages times hours. If your team is scattered across sites without smart batching, this line item is often larger than anyone realizes. The mechanics of squeezing this down without expensive routing software are worth reading separately in this breakdown of batching rules and travel KPIs for multi-site teams.
Rework and re-inspection is the cost of doing the job twice. A report kicked back for a missing field, a re-visit because the photo didn't survive the audit, a package rejected in QA. Each bounce is inspector time plus reviewer time plus, sometimes, another trip. A lot of quiet cost accumulates here because nobody logs it as a separate event — it just gets absorbed into "how long things take."
The pattern that trips people up: they try to model everything. A budget case with 18 KPIs feeding it isn't more convincing, it's less. Finance stops trusting a model they can't audit in five minutes. Pick two or three lines that carry most of the value, model those hard, and mention the rest as upside you're deliberately not counting. Conservative cases win approvals.
Building the ROI workbook: structure that holds up
A workbook that survives scrutiny has clean separation between four things: your baseline, your assumptions, your projected state, and the math that connects them. Mix those together and nobody can check your work, which means nobody trusts it.
| Sheet | What lives here | Why it's separate |
|---|---|---|
| Baseline | Current KPI values, pulled from actual records | This is your evidence — it can't be an estimate |
| Assumptions | Wage rates, mileage cost, expected % improvements | Everything a skeptic will challenge sits in one place |
| Projected state | Post-change KPI values | Lets you show the delta clearly |
| Cost (TCO) | License, implementation, training, ongoing | Full picture, not just the sticker price |
| Summary | Net benefit, payback period, ROI % | The only sheet an exec reads |
The discipline here is putting every challengeable number on the Assumptions sheet. When finance says "20% closure improvement seems aggressive," you change one cell and the whole model updates live in the meeting. That single move does more for your credibility than any slide deck, because it proves the case isn't built around a predetermined answer.
Put every challengeable number on the Assumptions sheet so finance can change one cell live.
For the baseline, don't estimate. Pull real numbers. If your analytics aren't mature enough to produce clean baselines, that's a prerequisite to fix first — the KPI taxonomy and dashboard cadence approach here is a reasonable place to start before you attempt an ROI model at all. A model built on guessed baselines is worse than no model, because the first time someone catches a made-up figure, they stop believing everything else in the workbook.
A model built on guessed baselines is worse than no model, because the first time someone catches a made-up figure, they stop believing everything else in the workbook.
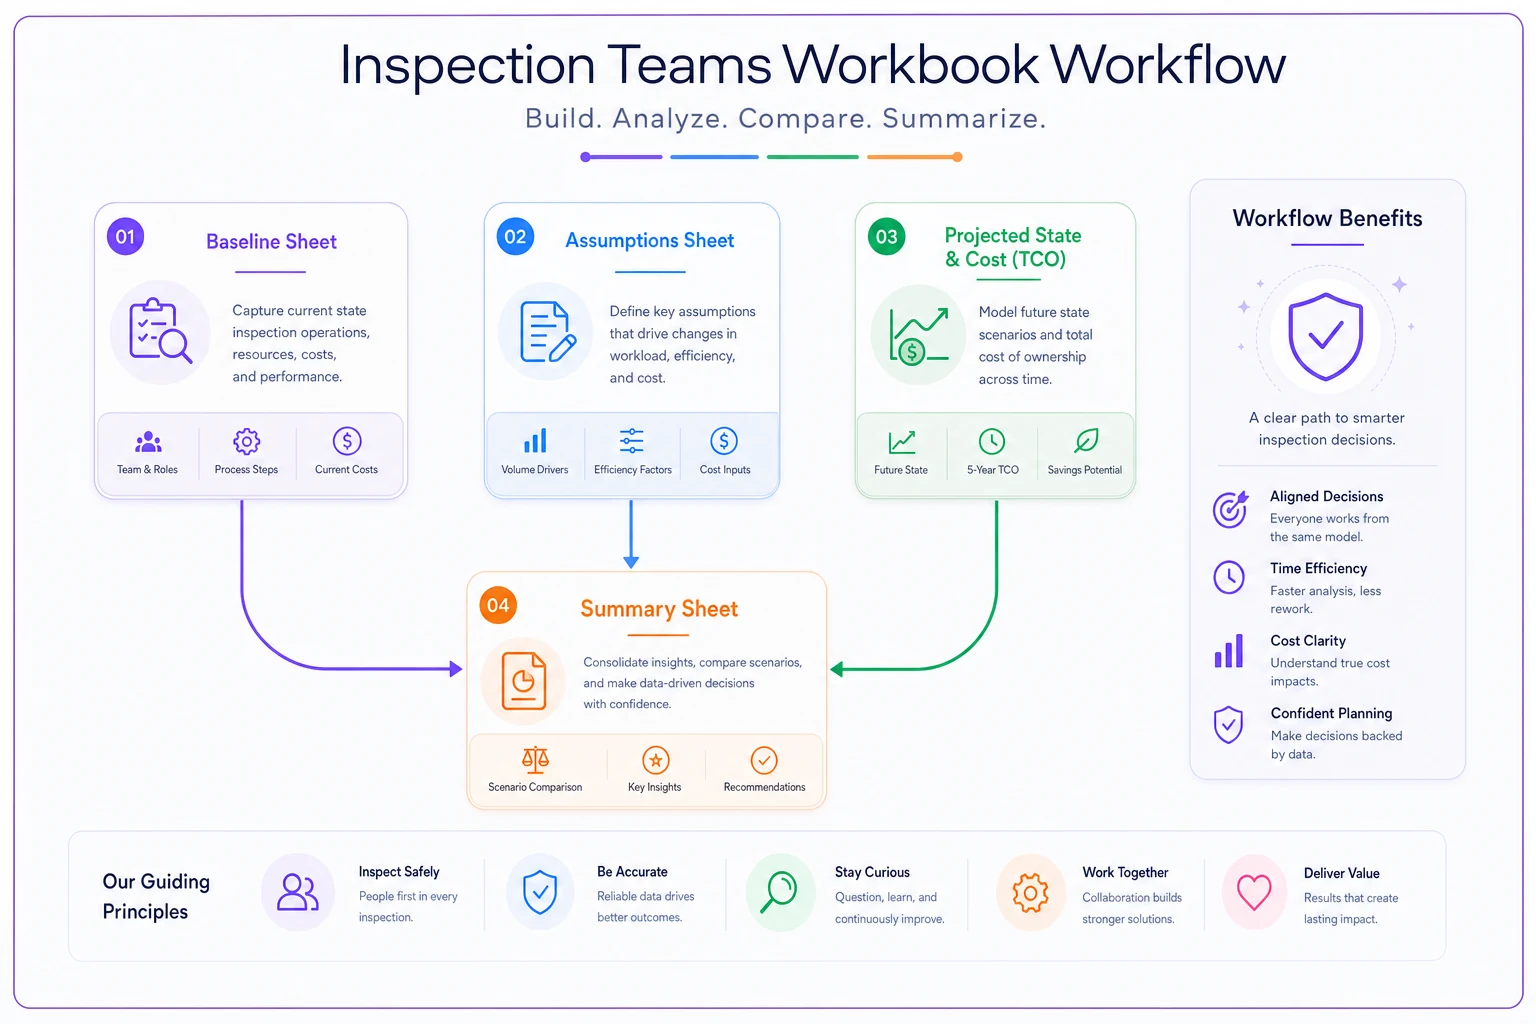
A simple visual helps people see how the sheets fit together.
A realistic worked example
Take a mid-sized inspection team — seven field inspectors covering a region, running around 60 to 70 inspections a week between them.
Their baseline looked something like this: average closure time around 24 days, each inspector logging close to 9 hours a week in travel (a chunk of it avoidable because scheduling ignored geography), and QA bouncing back roughly 12% of packages for rework — usually a missing photo or incomplete field — with each bounce costing about 40 minutes of combined inspector and reviewer time, plus the occasional re-visit.
Loaded inspector cost was roughly $52 an hour.
The travel line alone: 7 inspectors × ~4 avoidable hours a week × 48 working weeks × $52 comes out to around $70k a year in paid time producing nothing. Rework added another chunk — 65 weekly inspections × 12% bounce rate × 40 minutes, plus a handful of re-visits, landing somewhere in the $30k–$40k annual range once you fold in the trips.
The proposed change — better scheduling logic, structured digital packages that won't submit incomplete, tighter QA at capture — projected cutting avoidable travel roughly in half, dropping the bounce rate toward 5%, and pulling closure time under 15 days.
On the cost side, the honest TCO wasn't just the annual license. It included implementation, data migration, and a training and parallel-run period that consumed real internal hours in the first quarter. First-year total cost landed noticeably higher than year two because of that one-time load — which is exactly why you model years separately.
Net of everything, the model showed payback a little past the one-year mark. The closure-time improvement freed capacity worth more than the travel savings but was harder to bank, so it got flagged as upside rather than counted as cash. That distinction is what made the case believable. The hard-dollar travel and rework savings covered the payback on their own; the capacity gain was gravy the CFO could accept without feeling like it was load-bearing.
Sensitivity analysis: the part that earns trust
Every ROI number is wrong. The question is how wrong, and in which direction. Sensitivity analysis is you answering that question before finance asks it — which flips the dynamic entirely, because now you're the one being rigorous instead of the one being interrogated.
-
Downside — assume you hit only half your projected improvements, and TCO runs 20% over. If the case still clears your hurdle rate here, you've basically won.
-
Expected — your honest best estimate. This is the headline number.
-
Upside — everything lands and the capacity gains get realized. Mention it, but don't lead with it.
Then identify which assumption the whole thing hinges on. In most inspection models it's one of two things: the wage rate (because it multiplies through everything) or the improvement percentage on your biggest KPI. Show finance the break-even point — the exact improvement level below which the investment stops making sense. When you can say "this pays for itself as long as we cut avoidable travel by at least 30%, and we're conservatively projecting 50%," you've handed them the safety margin they were going to demand anyway.
One mistake worth avoiding: don't run sensitivity on everything. Flexing 15 variables at once produces a chart nobody reads. Flex the two or three that actually move the outcome. A tight sensitivity table on the load-bearing assumptions reads as competence. A sprawling one reads as noise.
The executive one-pager
The workbook is for you and for the analyst who wants to check your math. The one-pager is for the person who signs. These are different documents with different jobs, and collapsing them is a common mistake — nobody at the approval level is reading your Assumptions tab.
-
The ask — how much, over what period, one sentence
-
The problem in numbers — current closure time, travel cost, rework rate, stated plainly
-
The expected outcome — the projected state, three metrics max
-
The money — payback period and net benefit, expected case, with the downside case noted in one line
-
The risk — what has to be true for this to work, honestly stated
That last bullet is the one people skip, and skipping it is a mistake. Executives approve requests from people who name their own risks faster than requests that pretend there aren't any. "This depends on inspectors actually adopting the new scheduling — here's how we'll drive that" is more fundable than a flawless-looking projection with no acknowledged weak point.
When this whole exercise makes sense — and when it doesn't
Building a full ROI/TCO workbook is real work. It's worth doing when the ask is material — a new platform, a headcount decision, a multi-site rollout — and when you have, or can quickly produce, trustworthy baseline data. Above a certain dollar threshold, finance expects this level of rigor and won't move without it.
It's a bad idea when your baselines are guesses. A polished model built on invented numbers is a liability, not an asset — it looks confident and collapses the moment someone tests one figure. Fix your measurement first, then model.
It's also overkill for small, obvious asks. If you need a $400 camera upgrade that survives audits, don't build a five-sheet workbook for it. Match the effort to the size of the decision. Managers who over-model small requests train finance to see them as people who make everything complicated, which tends to hurt them when the big ask eventually comes.
If your program genuinely can't tie a single downstream cost to slow closures — no stalled payment, no delayed certificate, no capacity constraint — then closure time might be a real operational concern but a weak ROI lever. Be honest about that and build the case on travel and rework instead. A narrow, defensible case beats a broad, shaky one every time.
Where the numbers come from
None of this works without clean operational data, and that's the quiet dependency underneath the whole thing. If your closure times live in someone's head, your travel hours are approximated from memory, and rework never gets logged as a distinct event, you don't have a baseline — you have anecdotes with decimal points.
This is where having your inspection records and KPIs flowing through a single operational system pays off well before you ever build a budget case. When closures, travel, evidence completeness, and QA bounces are captured as structured data instead of scattered across spreadsheets and inboxes, the baseline sheet nearly writes itself. You pull the numbers instead of reconstructing them, and you can show finance exactly where each figure came from.
A model whose baselines trace back to actual records is hard to argue with — which is really the whole point of the exercise. The teams that get funded aren't the ones with the best rhetoric. They're the ones who can open the workbook, click any number, and show exactly how it was calculated. Build for that, and the budget conversation stops being a pitch and starts being a review of evidence — which is a conversation you can actually win.
Ready to modernize your inspection process?
Join 500+ inspection teams using Chekzly to reduce paperwork, improve compliance, and accelerate reporting.