



Most capacity shortfalls don't show up as a dramatic failure. They show up as a slow creep: your SLA hit rate slides from 94% to 88%, inspectors start skipping lunch, overtime quietly doubles, and three months later you're staring at a backlog you can't explain to procurement. Nobody made a bad decision. The math just never got done.
That's the frustrating part about inspector capacity planning. It's not hard math. It's arithmetic most managers could do in a spreadsheet. But it rarely gets done properly because the inputs are scattered — travel time lives in one head, historical volumes live in a dashboard nobody exports, and SLA targets live in a contract PDF. So headcount gets set off gut feel and last quarter's pain.
The heuristics below actually hold up in the field, with worked numbers you can copy.
The core formula nobody writes down
At its simplest, capacity planning answers one question: do the productive hours I have cover the demand I'm committed to, with enough slack that one sick day doesn't blow up the week?
Everything else is just filling in that equation carefully. The structure that keeps coming up:
Required inspectors = (Forecasted jobs × avg job time incl. travel) ÷ (Available productive hours per inspector × utilization target)
The reason teams get this wrong isn't the formula. It's that they plug in fantasy numbers — an 8-hour day as if all 8 hours are billable, a 30-minute inspection that's really 52 minutes with travel and write-up, a demand forecast that ignores the March spike every single year.
Each input deserves some real attention, because that's where the planning actually lives.
Input 1: Forecasted job volume (don't just average)
The lazy version is taking last year's total and dividing by 12. That hides everything that matters.
-
Seasonality — HVAC inspections spike pre-summer, roofing after storm season, elevator certs cluster around compliance deadlines.
-
Day-of-week skew — Mondays and Fridays are routinely 20–30% lighter in scheduled work for a lot of commercial programs.
-
Trailing growth — if your client base grew 15% last year, your average month understates next quarter.
A better heuristic: take the last 12–18 months of monthly volumes, pull out the peak and the trough, and plan your baseline staffing around the 70th–75th percentile month — not the mean. You absorb the troughs with slack and the peaks with buffers. Planning to the average guarantees you're understaffed roughly half the year.
Input 2: Average job time — the number everyone underestimates
The single biggest error in practice: timing the inspection itself and calling that "job time."
The actual unit of work is:
Drive to site + setup + inspection + photos/evidence + write-up + drive to next.
A "30-minute" inspection in a dense urban route might be 75 real minutes door-to-door. The same inspection in a rural territory with 40-minute drives could be 110. If you plan with 30, you've overstated capacity significantly and you won't know until the backlog hits.
Travel is usually the fattest hidden slice, which is why routing and batching matter so much to effective capacity. If you haven't tightened this, it's worth reading the breakdown on reducing inspector travel time without complex algorithms — shaving travel directly expands capacity without hiring anyone.
A practical approach: pull 20–30 recent jobs of each type, calculate real door-to-door time from timestamps, and use the median, not the average. Averages get wrecked by the one job where the inspector got stuck for two hours. The median reflects a normal day.
Use the median, not the average, when you calculate door-to-door job times to avoid skew from outliers.
Input 3: Available productive hours (the 8-hour day is a lie)
An inspector on payroll for 8 hours is not available for 8 hours of inspections. Strip out:
-
Breaks and lunch (~0.75–1 hr)
-
Admin, email, sync meetings (~0.5–1 hr)
-
Vehicle, equipment, calibration checks (~0.25–0.5 hr)
-
PTO, training, sick time (amortized across the year)
A realistic productive window for a field inspector is somewhere around 5.5 to 6.5 hours per 8-hour day before you even apply a utilization target. Teams that plan on 7+ are the ones constantly surprised by overtime.
Input 4: Utilization target (and why 100% is a trap)
Utilization is the share of productive hours you actually schedule as billable work. New managers love to push this toward 95%+. That's exactly how you end up overbooked.
| Utilization target | What it really means | Realistic for... |
|---|---|---|
| 60–70% | Lots of slack, fast SLA recovery | High-variability, emergency-heavy work |
| 70–80% | Healthy balance | Most mixed inspection programs |
| 80–85% | Tight, little margin for error | Stable, predictable, routine-heavy routes |
| 90%+ | No buffer, burnout territory | Basically never sustainable |
Running at 90%+ means a single no-show client, a reschedule, or a sick inspector cascades into missed SLAs — there's no room to absorb anything. The sweet spot for most teams sits around 75–80%. That "wasted" 20% is what keeps you on-time when reality hits.
Worked example: a mid-size commercial inspection team
A regional commercial property inspection outfit, roughly 9 inspectors, mixed residential-commercial work.
Eliminate inspection delays and errors.
Chekzly helps you plan, execute, and document inspections efficiently and accurately.
- Real-time inspection tracking
- Automated report generation
- Compliance and checklist management
No credit card required
The inputs they actually measured:
-
Forecasted jobs (75th-percentile month)
about 640 inspections/month
-
Real median job time door-to-door
1.6 hours (inspection ~45 min, travel + write-up the rest)
-
Working days/month
21
-
Productive hours/day/inspector
6.0
-
Utilization target
78%
Step by step:
-
Monthly demand in hours
640 × 1.6 = 1,024 inspection-hours
-
Effective productive hours per inspector per month
6.0 × 21 × 0.78 = 98.3 hours
-
Required inspectors
1,024 ÷ 98.3 ≈ 10.4
So the right number is 11 inspectors, rounding up. They were running 9.
That gap — 2 heads — explains everything they were feeling: the slipping SLA rate, the overtime, the inspectors pushing write-ups to the weekend. They weren't disorganized. They were structurally short by about 18%.
Notice what happens if you'd used fantasy inputs instead: job time of 1.0 hr and utilization of 90% gives you 640 ÷ (6×21×0.9) = 5.6 inspectors. You'd confidently staff 6, run a disaster, and blame the team.
Buffers: the part that separates planning from guessing
The calculation above gives you baseline staffing. Buffers handle the variance that baseline can't absorb.
Demand buffer — for volume spikes above your planning percentile. If your peak month runs 25% over your 75th-percentile baseline, you need a plan for those extra jobs before they arrive: overtime capacity, a flexible per-diem inspector, or a vendor overflow agreement. Deciding this in advance is the whole point.
Availability buffer — for inspector absence. Across most field teams, realistic unplanned absence plus PTO lands around 10–15% of available days over a year. Plan headcount with zero absence buffer and you're effectively planning to be short one inspector per 7–10 on any given week.
A heuristic that holds up: add one effective FTE of flex capacity for every 8–10 baseline inspectors, delivered through some mix of overtime, per-diem, or a vendor bench. In the example above, that turns 11 into "11 plus a reliable overflow plan" — not 12 full-time hires.
When the formula lies to you
A few situations where this heuristic breaks and needs adjustment:
-
Emergency-driven work. If a big chunk of your volume is unscheduled or urgent — storm response, incident-triggered — your utilization target needs to drop into the 60–70% range because you're holding capacity in reserve, not filling it.
-
Highly specialized certs. If only 2 of your 11 inspectors can do pressure-vessel or elevator work, your aggregate math might look fine while you're actually bottlenecked on a skill. Plan capacity per skill pool, not just in total.
-
New territories. Travel-time medians from a dense metro will badly understate job time when you expand into rural coverage. Re-measure before you forecast.
Plan capacity per skill pool, not just in total.
Where this quietly falls apart at scale
One team can do this in a spreadsheet once a quarter. The problem is keeping it alive. Travel times drift as routes change, job mix shifts, a new client adds 80 sites, and the spreadsheet from January no longer reflects June. Most programs don't fail because they can't do the calculation — they fail because nobody re-runs it until the backlog forces them to.
This is the same pattern that shows up when inspection programs fail to scale: the operational math existed once, then went stale, and decisions drifted back to gut feel.
The practical fix is to stop treating capacity planning as a one-off and wire the inputs to live data. When your scheduling system already captures real door-to-door timestamps, actual utilization, and booked volume, the heuristic above can recalculate continuously instead of quarterly. AI-assisted operational platforms help here mostly by doing the tedious part — pulling median job times by inspection type, flagging when utilization creeps past your threshold, and surfacing the headcount gap before SLAs slip rather than after. The math doesn't change; it just stops being something a human has to remember to do.
A short capacity-planning checklist
Before you argue for more headcount — or defend your current number — make sure you've actually got these:
-
[ ] Monthly volumes pulled for the last 12–18 months, not just last quarter
-
[ ] Planning volume set to the 70th–75th percentile month, not the average
-
[ ] Real median job time including travel, setup, evidence, and write-up — measured from timestamps, not estimated
-
[ ] Productive hours per day set realistically (likely 5.5–6.5, not 8)
-
[ ] Utilization target chosen deliberately (most teams
75–80%)
-
[ ] Demand buffer defined for your peak month
-
[ ] Availability buffer of ~10–15% for absence and PTO
-
[ ] Specialized skills planned as separate capacity pools
-
[ ] A trigger to re-run the numbers (quarterly at minimum, or when volume shifts more than 10%)
A trigger to re-run the numbers (quarterly at minimum, or when volume shifts more than 10%)
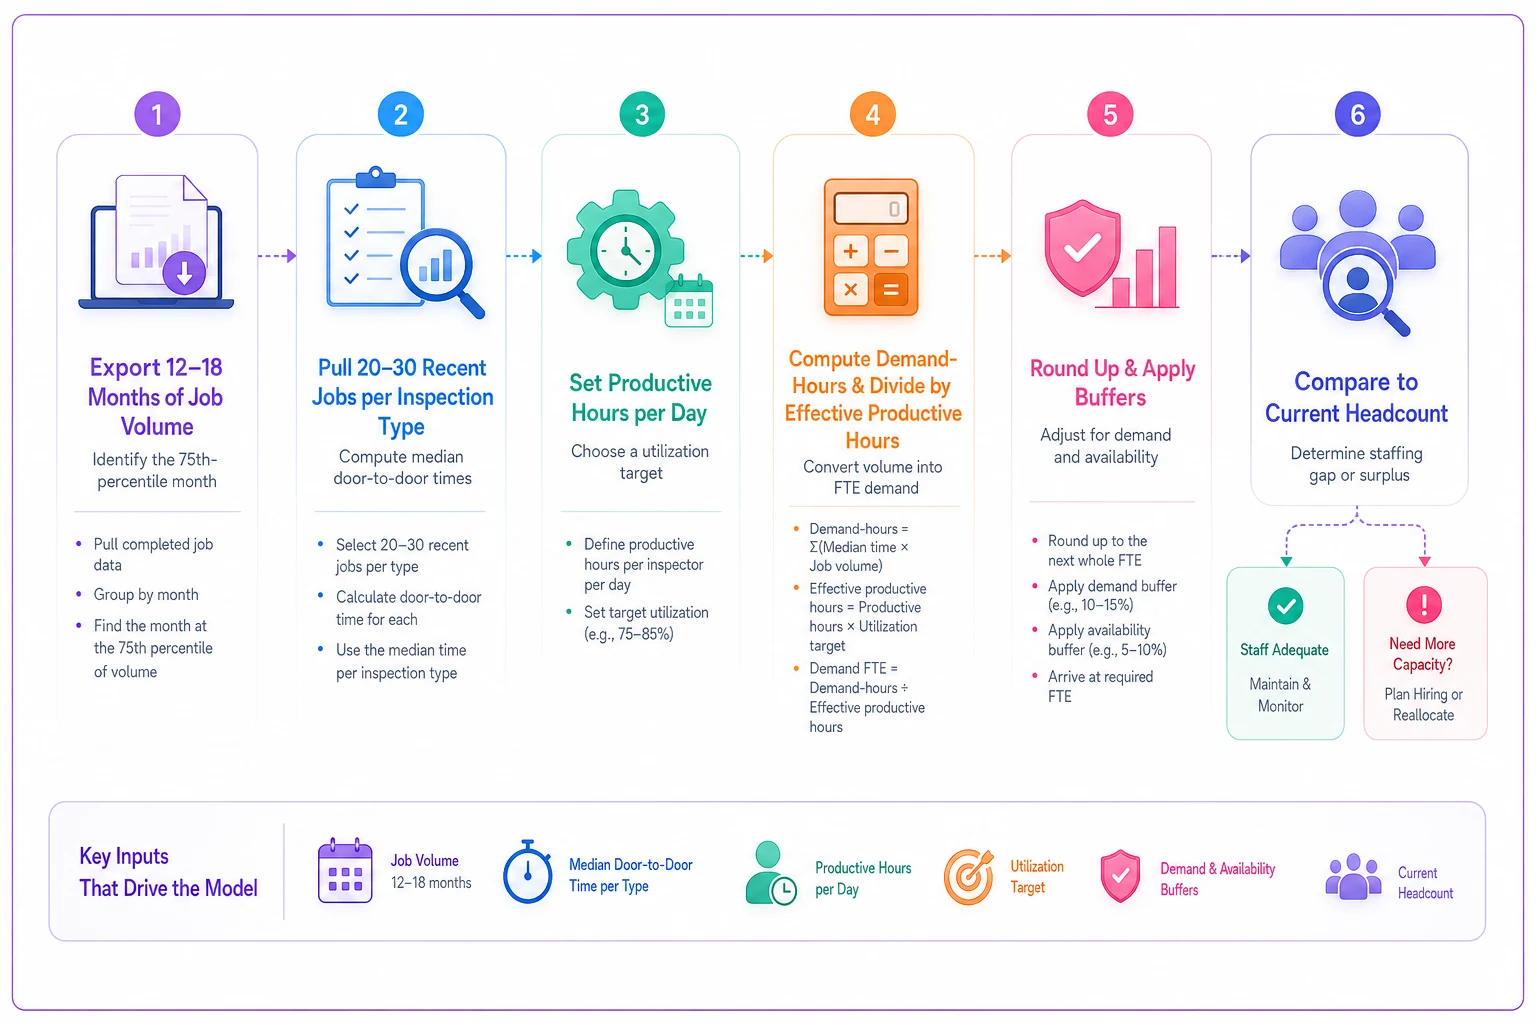
The quick process to do it this week
A quick workflow to get this done this week:
-
Export 12–18 months of job volume and find your 75th-percentile month.
-
Pull 20–30 recent jobs per inspection type, calculate real door-to-door time, take the median.
-
Set productive hours/day honestly and pick a utilization target.
-
Run the formula
demand-hours ÷ (productive hours × days × utilization).
-
Round up, then layer your demand and availability buffers on top.
-
Compare to current headcount — the gap is your business case.
Compare to current headcount — the gap is your business case.
Bottom line
Being understaffed and overbooked almost never means you hired the wrong people or that they're slow. It usually means the staffing number was set against optimistic inputs — a full working day, a utilization target too close to 100%, and a job time that forgot travel existed. Fix the inputs, use the median not the average, plan to a realistic percentile instead of the mean, and leave yourself a buffer that reflects how messy field work actually is. Do that, and the headcount conversation stops being a fight about effort and starts being a conversation about arithmetic — which is a much easier argument to win.
Ready to modernize your inspection process?
Join 500+ inspection teams using Chekzly to reduce paperwork, improve compliance, and accelerate reporting.